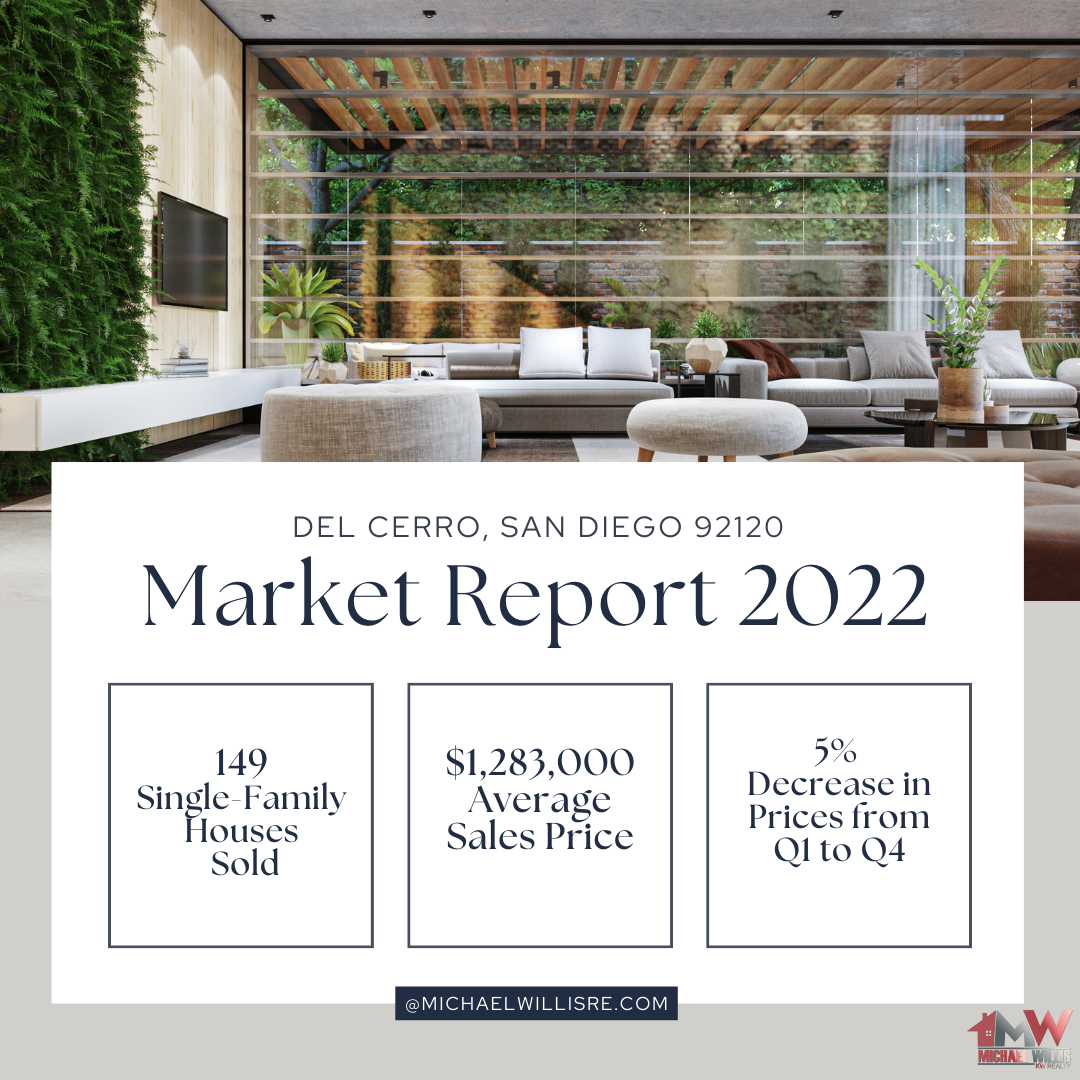
Happy New Year! It’s that time of the year again and I want to reflect on real estate activity in 2022 for Del Cerro, San Diego, 92120. Only single-family detached homes were used for this analysis. In 2022, there were 149 sales with an average price of $1,283,000. The average sales price in Q1 of 2022 started high at $1,410,206 and went down each quarter to a low of $1,109,577 during Q4 of 2022 (a decrease of 27%). When we look at the change in price per square foot, there were more modest changes with Q1 having an average of $599/sf while Q4 had an average of $570/sf (a 5% decrease in values). This paints two completely different pictures with a large decrease in average sales prices at 27% and a smaller decrease of 5% when looking at the changes in price per square foot. This is the reason why I like to look at changes in price per square foot since Q1 had much larger homes selling than Q4 which had smaller homes thus exaggerating the decrease in average sales prices. The average days on the market for a home in Del Cerro was 18 days. 2022 was overall a down year compared to the previous years mostly due to the interest rate hikes that the Fed introduced starting in May and continuing up until the end of the year. An increase in interest rates typically has an inverse relationship with home values. As higher interest rates set in and become the new norm, what do you think will happen to the real estate market in 2023?